> ## Documentation Index
> Fetch the complete documentation index at: https://radarlabs-update-tracking-options.mintlify.site/llms.txt
> Use this file to discover all available pages before exploring further.
# Logging and analyzing where conversions occur
Conversions are available on the [**Enterprise plan**](https://radar.com/pricing).
In this tutorial, we show you how to use Radar's [conversions API](/api#log-a-conversion) to analyze the location context associated with key customer interactions. Conversions can represent anything from a purchase or signup to engagement with an in-app feature.
When these events are enriched with Radar's location context, they can be used to determine where these conversions occur and measure the value of location based features.
## Languages used
* Swift
* Kotlin
## Features used
* [iOS SDK](/sdk/ios)
* [Android SDK](/sdk/android)
* [Conversions API](/api#log-a-conversion)
## Steps
If you haven't already, sign up for Radar to get your API key. You can create up to 1,000 geofences and make up to 100,000 API requests per month for free.
[**Get API keys**](https://radar.com/signup)
#### **iOS**
If you're starting from scratch, create a new Xcode project of type Single View App.
[Install the iOS SDK](https://docs.radar.com/sdk/ios#install-sdk) using CocoaPods or Carthage (recommended) or by [downloading the framework](https://github.com/radarlabs/radar-sdk-ios/releases) and dragging it into your project.
Initialize the SDK in your `AppDelegate` class with your publishable API key.
```swift theme={null}
import UIKit
import RadarSDK
@UIApplicationMain
class AppDelegate: UIResponder, UIApplicationDelegate {
func application(_ application: UIApplication, didFinishLaunchingWithOptions launchOptions: [UIApplication.LaunchOptionsKey: Any]?) -> Bool {
Radar.initialize(publishableKey: "prj_test_pk_...")
return true
}
}
```
#### **Android**
The best way to add the SDK to your project is via Gradle. See the [Android SDK installation guide](https://docs.radar.com/sdk/android#install-sdk).
When your app starts, in application `onCreate()`, initialize the SDK with your publishable API key.
```kotlin theme={null}
import io.radar.sdk.Radar
class MyApplication : Application() {
override fun onCreate() {
super.onCreate()
Radar.initialize(this, "prj_test_pk_...")
}
}
```
To take advantage of Radar's conversions API, you need to identify the events that are important to your business. Here are some examples:
| **Conversion name** | **Example purpose** | **Placement** | **Event properties** |
| :------------------ | :---------------------------------------------------------------------------------------------------------- | :------------------------------------- | :------------------------------------------------------------------------ |
| `purchase` | Measure the revenue driven from location-enabled features | After a user makes a purchase | `revenue` (number)
`pickup` (boolean)
`in_store_mode` (boolean) |
| `order_placed` | Understand where users are placing orders within the app to prioritize personalized features | After a user places an order | `revenue` (number)
`applied_coupon` (boolean) |
| `sign_up` | Measure which stores are driving sign ups through store promotions | After a user completes the signup flow | `referrer` (string)
`rewards` (boolean) |
| `product_search` | Understand where customers are searching for products (i.e., in specific stores or at competitor locations) | After a user searches for a product | `section` (string) |
On the [Geofences page](https://dashboard.radar.com/geofencing/geofences), import geofences for your locations. For places, on the [Settings page](https://dashboard.radar.com/settings), monitor your desired place chains and categories. When processing conversions, Radar will determine if they happen at any of these geofences or places.
The following example demonstrates how to log a conversion when a user makes a purchase.
```swift Swift theme={null}
// on making a purchase
Radar.logConversion(
name: "purchase",
revenue: 12.50,
metadata: ["product":"shirt"]
) { (status, event) in
print("Logged conversion: status = \(Radar.stringForStatus(status)); event = \(String(describing: event))")
}
```
```kotlin Kotlin theme={null}
// on searching for a product
val metadata = JSONObject(mapOf("product" to "shirt"))
Radar.logConversion(
"purchase",
12.50,
metadata
) { status, event ->
Log.v("example", "Conversion = ${event?.type}: status = $status; event = $event")
}
```
The [Report](https://dashboard.radar.com/geofencing/analytics/conversions) page of the Radar dashboard has a *Conversions* tab that provides an overview of all conversions logged for a project. Understand how engagement with your app differs between opted-in and opted-out users. See the total revenue across all conversions that have been logged with `revenue`.
Below is an example of a fully populated *Conversions* page for a project that has logged conversions for `purchase` and `opened_notification` events:
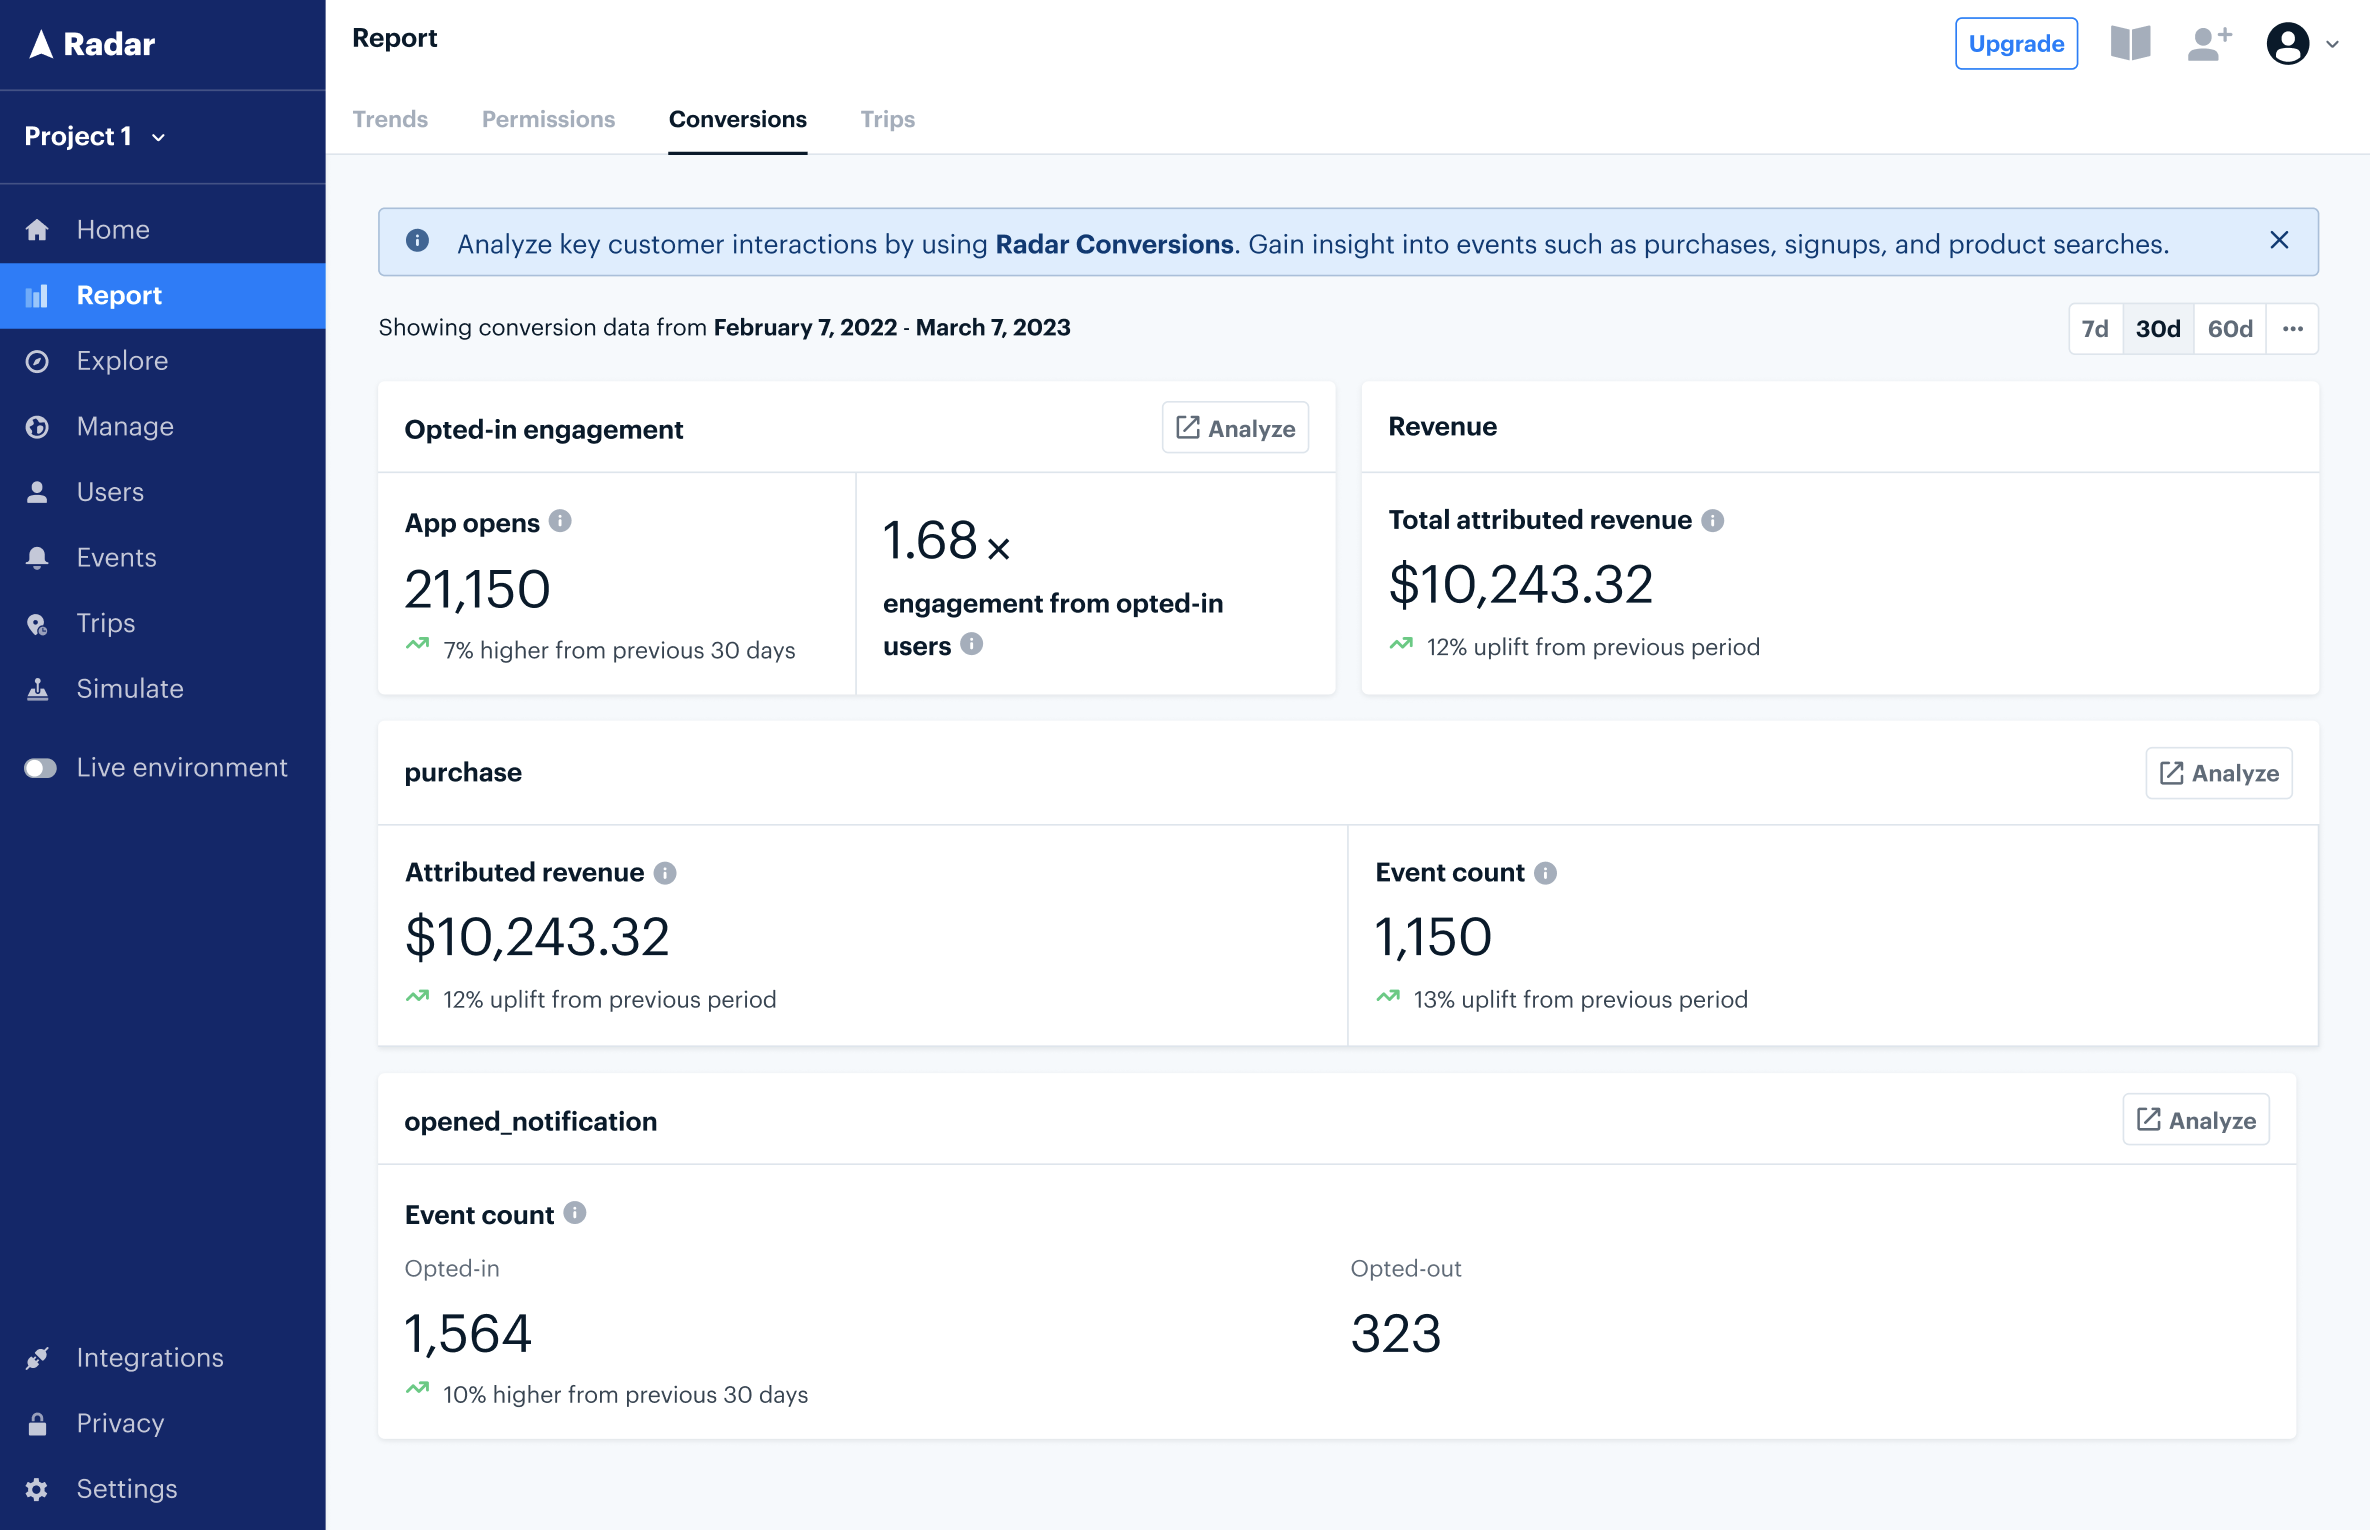 You can see when and where conversions were generated directly in the Radar dashboard. On the [Events](https://dashboard.radar.com/geofencing/events) page, watch as conversions start to stream in:
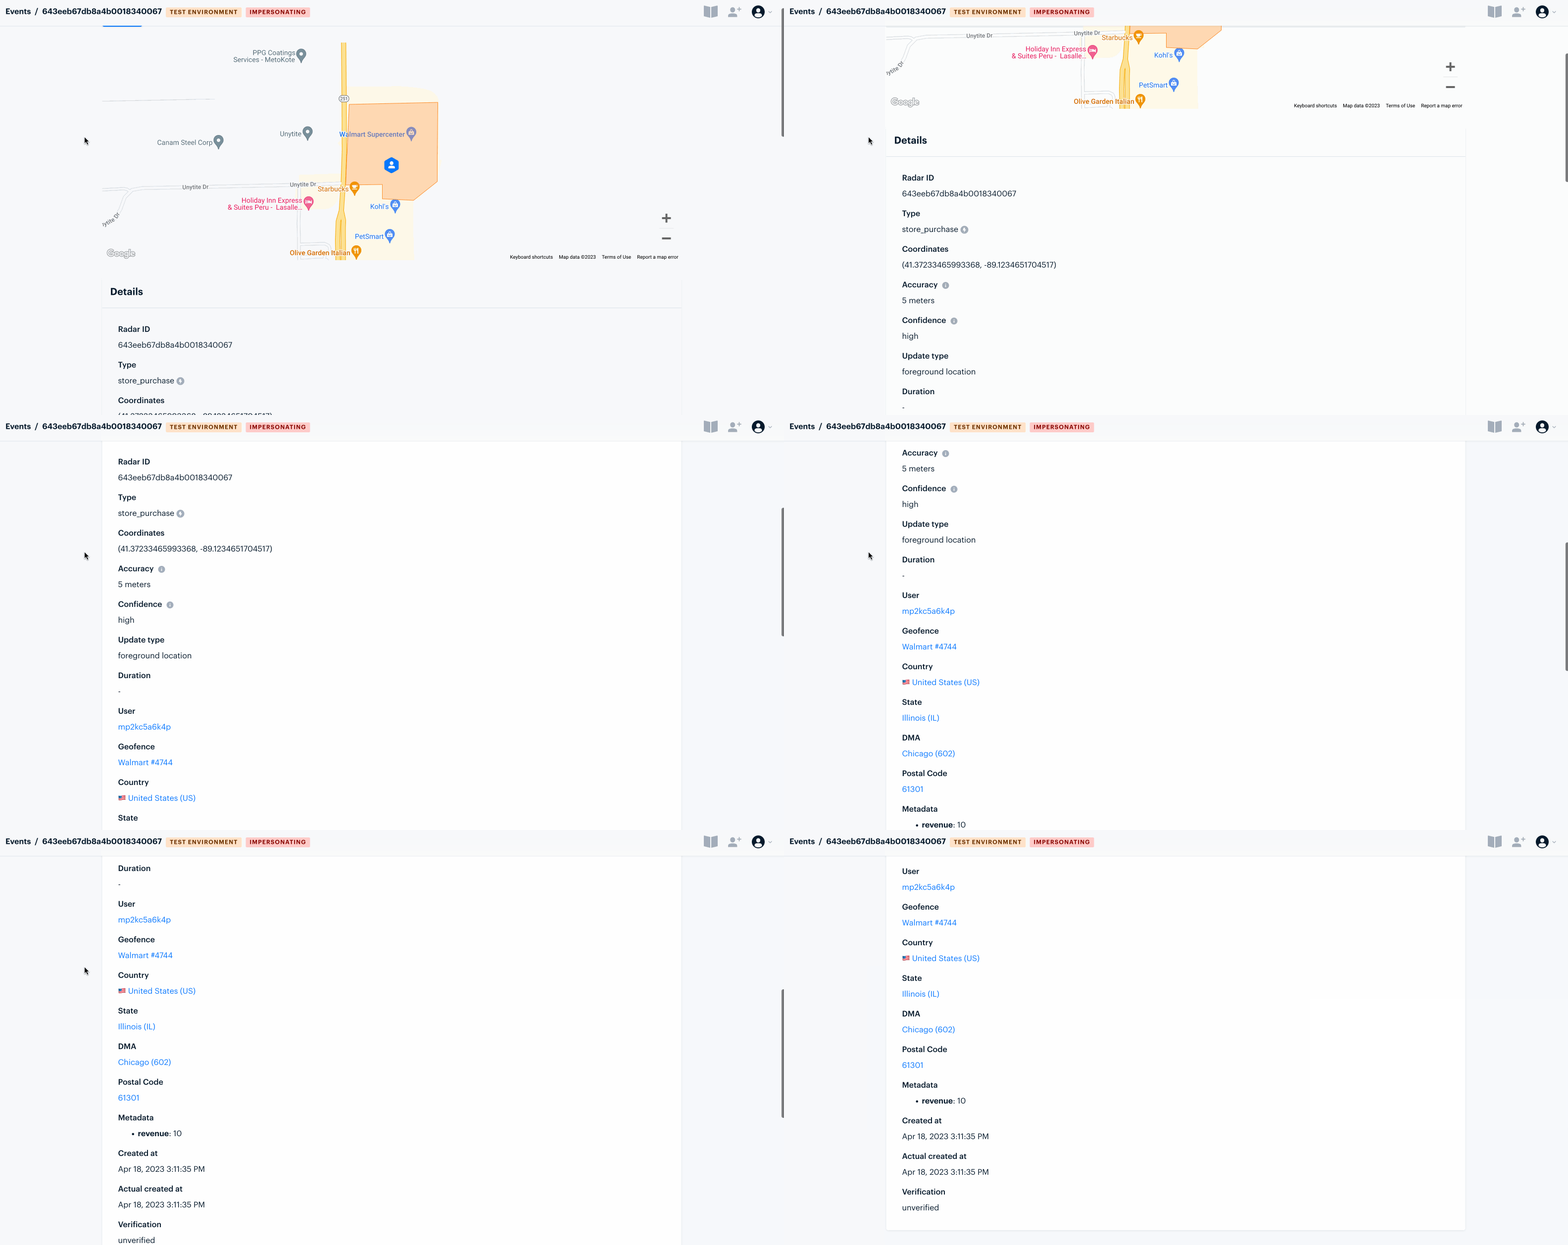
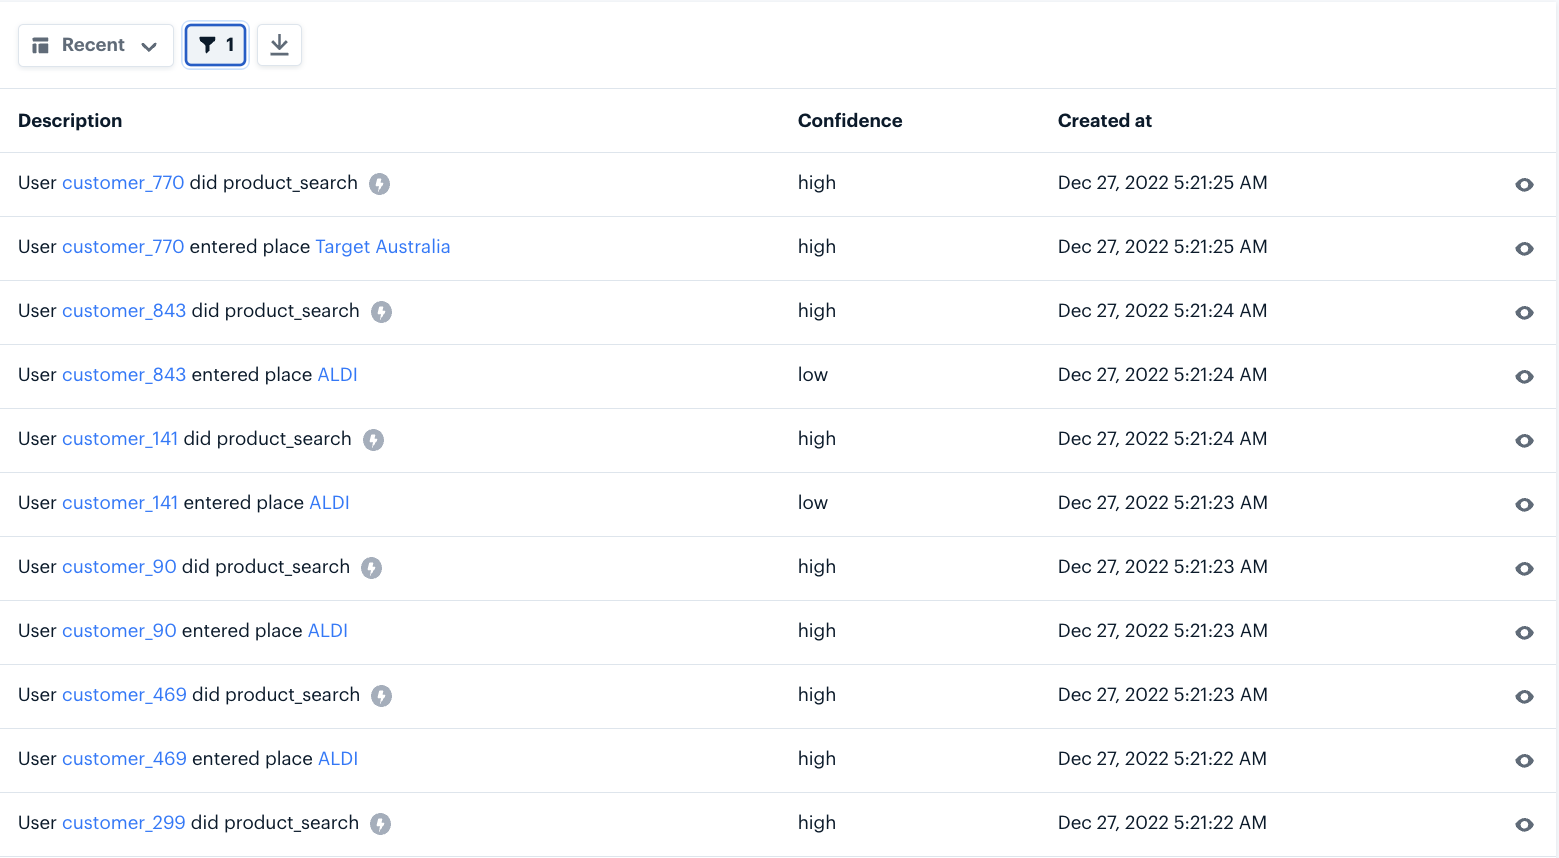 Click the\_View icon\_ on the right to view a conversion's details:
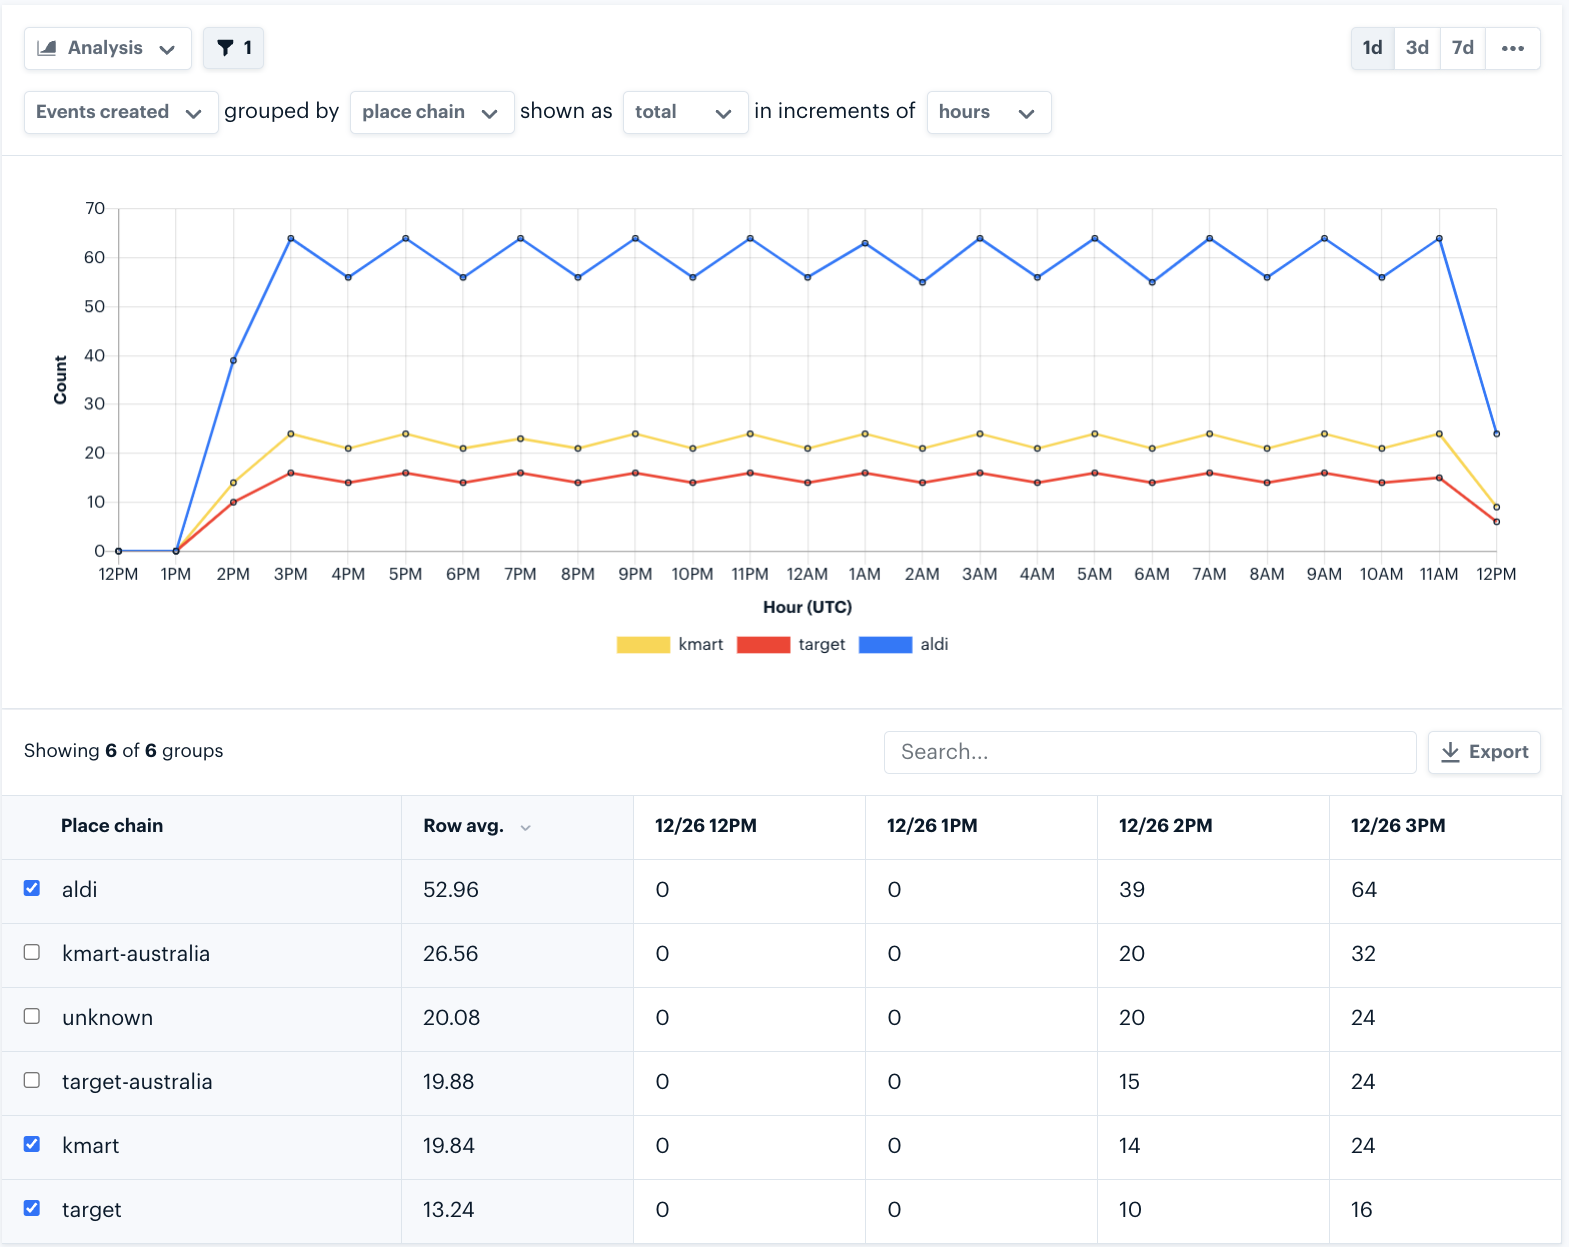
 Finally, select *Analysis* within the dropdown on the [Events](https://dashboard.radar.com/geofencing/events) page to view all of your conversions sliced by different dimensions, such as place chain or geofence tag: